Learn something new: Excel
Full disclosure: I am not an expert at spreadsheets. In fact, prior to teaching, I used them in one temporary job where the maximum skill required was learning how to apply and unapply filters. This was simply to locate the location of a set of physical files between various hospitals to have those files carried to another by courier. The end. That was it. No formulas. Just filter, make a note, unfilter, end exercise.
In teaching, I have used very basic spreadsheets for the purpose of keeping track of student work (offline) and used school or district Google sheets to input data for various data collection purposes. Again, simple data entry. Nothing fancy (someone else did that).
My initial goal in learning something new was to learn how to import excel gradebooks into Powerschool. This is the program that my district (and many others) use. I’m not saying it’s bad but I do not like it. It is not user-friendly for me. I’m no tech guru, but it’s data entry at my level. That is, of course, after you create assignments for each assignment you want graded. So, say you want to grade every day’s homework for 170 school days. That’s 170 assignments that you must create. I do not do that. That’s tedious and redundant. I use excel to track every assignment because it’s new column apply percentage insert grades end exercise. Even as easy as that sounds, it’s still tedious with 70 or so students every day. Then I go and insert their quarterly or semesterly average as the end of the marking period approaches. So, I wanted a way to import those Excel columns into Powerschool in the same way I do now, but with all of the assignments. It turns out I can import spreadsheet data one assignment at a time. docs.powerschool.com/PTPH/late… Big ups to Powerschool for that giant explanatory waste of time.
So now what? I still have to use Powerschool because that’s what my district pays money for. Same old same old in that regard. I will still be keeping grades in Excel, offline, until Powerschool catches up with my mind (and the same gradebook format that has been used since, I dunno, the sixties? Just columns and rows…
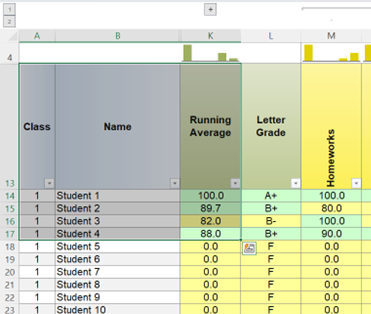
I am creating an active file to share with parents, but in my research on Excel, I found a fun tool that is kind of like creating an active PDF. So you can find a tool in the Quick Access Toolbar called “Camera” (it even has a camera icon). Then, you can select an area that you would like to share:
Like this.
Then you can click camera and it takes a kind of screenshot of it. I put it on a new sheet for demonstration purposes. I know you’re yawning. Here comes the fun part… You edit the original data.
Like this. And the “picture” you took changes.
Like this. And that picture cannot be manipulated. It’s like a window that you set parameters of. It’s magical. Unfortunately, it does not cross into Google sheets with the same magic. It’s just an image. That would have been clutch because we use Google docs to communicate items home to parents. So, I wasted an hour fooling around with that, but it gave me an idea for communicating data with parents and students. It’s a non-stop shop for data collection that can be shared to parents and students while also serving to collect individual data for each student. It’s like a math standards portfolio that can updated anytime (you have internet access). So it wasn’t a fully wasted hour. Now I just have to do all of that ahead-of-time work for my new students and families. What I have learned: Um, not much. I learned a single tool in Excel, that my intended goal is a dead end, and that I have a lot of self-inflicted work ahead of me (surprise, surprise). I also found a blog post about some (reportedly) not-so-well-known functions that can really help educators. They all looked really useful, but are generally above my knowledge level and all the “assumptions” the author made do not apply to me. Check it out here: www.schoolstatus.com/blog/5-ex… What I will strive to learn now: As I mentioned before, I am not the world’s foremost expert in Excel. In fact, I’m definitely in the lower half. Way, way lower. When I decided to look more into Excel and how it can help me monitor progress and collect data while also being internet access friendly, easy to follow and manipulate, and organized, I turned to the person every tech wizard turns to for help. I turned to the person that can find the scissors she asked me to find in, the drawer where the scissors always are, even though I don’t see them: my wife. Turns out my wife is something of a mid-level guru who has been working in and with Excel extensively since before I swept her off her feet (I’m a good sweeper) back in ’09.
My objectives: (This is the paraphrased version of what I remember our conversation sounding like a few nights ago). Me: “So, I use excel to keep track of grades, and I wanted to do something that I could export into Powerschool, so I could easily impo…” Her: “That reminds me, we have to fill out a bunch of forms in Elliott’s Powerschool for going into kindergarten.” Me: “Okay. Are you listening?” Her: “Yeah, you said Powerschool, so I just, never mind, go on.” Me: “well, it turns out I can’t really do what I want, so I want to make Excel really work for me.” Her: “what do you want?” Me: “So, I need a few things. I need a gradesheet that is easily adjusted by percentages. So say I want to do it chronologically. It would look like ‘Lesson 1, Lesson 2, homework, Lesson 3, Quiz, Lesson 4, Homework, Test’. Each homework might always be valued at 5%, while a quiz is valued at 10%. The total value of the lesson work would be 40%. The test might be 20%. Then I would have 25% credit for small group lessons, but those would change frequency based on each individual student in a given unit. Does what I’m asking make sense?” Her: “Sort of, I get the percentage parts. Not sure about that last part.” Me: “Well, secondly, I would need a sheet that I can track student progress on a given standard. That would be a 1, 2, 3, or 4 out of 4. In this circumstance I would want to know the average score for the class in each standard, which would be columns, and I would want to know the average score for each student in the rows. Also, for both, I need to be able to omit a particular cell from totals in case a student arrives later in the marking period or whatever” Her: “that’s easy” Me: “says you.” Her: “well, I can teach you how to make this.” And we’re off. To start, I made a sheet that is formulated to the structure of what I need (i.e. lessons, quizzes, homework, and assessments of a given unit). I did not/ cannot include student information because I do not have access to that information, but it can easily be filled at a later time. Next I started labelling the columns with what my anticipated timeline looks like based on last year’s scope and sequence of that grade level as provided by my soon-to-be grade partner. Then she showed me how to add the appropriate weight for each column and how to adjust it as needed. As for the standards grading, it was pretty straightforward. I also wanted to add some colors to indicate (at a quick glance) how students were performing based on their standards. So a 4 is purple (my favorite), 3’s range is blue, 2’s range is orange, and 1’s range is yellow. The important thing is to keep this updated regularly and use it as appropriate: to help kids get as close to purple as possible in each standard.
Images incoming…